Introduction
Every time you open your YouTube Studio dashboard, you are greeted by a wall of numbers, percentages, graphs, and green or gray arrows. For many creators, looking at this data feels like reading a foreign language. They check their total views, see if their subscriber count went up, and immediately close the tab.
Ignoring your analytics is the fastest way to let your channel quietly fade away.
Your analytics are not just a report card of your past performances; they are a roadmap for your future success. They tell you exactly why people are clicking away, which videos are making you money, and what your audience wants to see next. If your channel’s growth has stalled, it’s time to stop guessing and start looking at the data. Let’s break down the three most critical metrics you need to analyze to revive your channel.
1. Audience Retention (The First 30 Seconds)
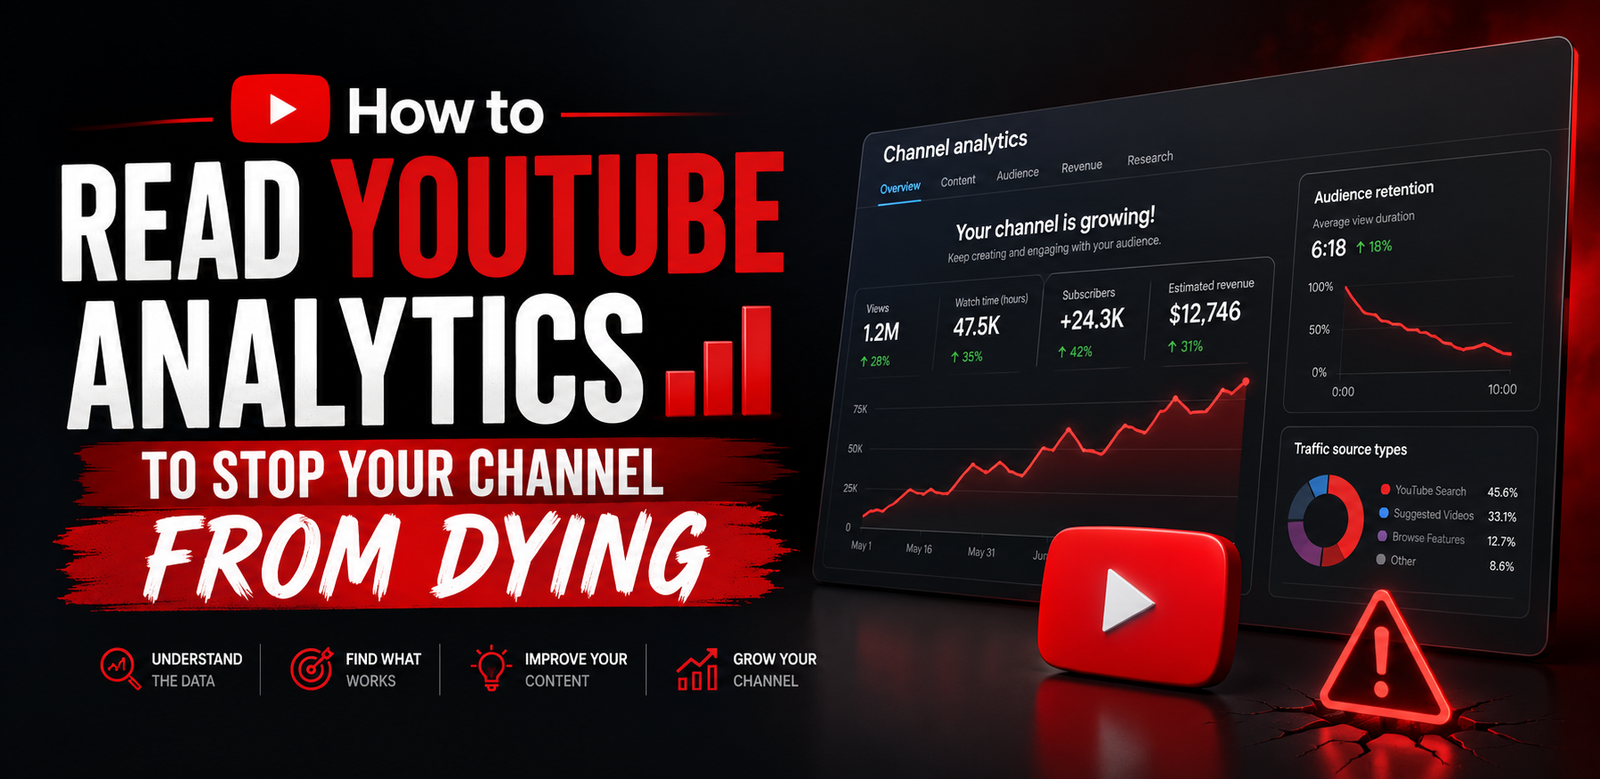
Views mean nothing if people are leaving your video after a few seconds. When you open the analytics for a specific video, look closely at the Audience Retention graph.
- The Cliff Effect: If you see a sharp, sudden drop in the graph within the first 30 seconds, it means your intro failed. You either spent too much time introducing yourself, had a boring animated logo, or misled the viewer with your thumbnail.
- The Valuation: A healthy channel should aim for at least 50% to 60% retention at the 30-second mark. If your retention is low, cut straight to the action in your next video without wasting time on fluff.
2. Click-Through Rate (CTR) vs. Impressions
Impressions tell you how many times YouTube showed your video thumbnail to a user. CTR tells you what percentage of those people actually clicked on it.
- High Impressions, Low CTR: This means the algorithm tried its best to push your video to an audience, but your title or thumbnail wasn’t attractive enough to make them click. The solution? Change your thumbnail immediately, even if the video has been live for weeks.
- Low Impressions, High CTR: This means the people who see your video love it, but the topic might be too narrow, or your metadata (titles/descriptions) isn’t optimized enough for the algorithm to find a wider audience.
3. Traffic Sources (Where Are Your Views Coming From?)
Understanding how people find your content changes your entire production strategy. Navigate to the “Reach” tab and look at your Traffic Sources breakdown.
- YouTube Search: If this is your highest source, you are winning at SEO. Your titles, tags, and descriptions are working perfectly. Keep making searchable, tutorial-based content.
- Suggested Videos / Browse Features: If these are high, it means the algorithm is naturally recommending your videos on the homepage and alongside other popular content. This is where viral growth happens, driven by high watch time and emotional hooks.
Conclusion
Data doesn’t lie. The next time a video underperforms, don’t get discouraged. Open your analytics like a detective, find the exact moment the graph drops, and vow to fix that specific mistake in your next project.
💡 Pro Tip: Analyzing your competitors can give you just as much insight as analyzing your own data. Use our free [Channel Audit Tool] or [Tag Extractor] to break down what is currently working for top creators in your niche and replicate their structural success.